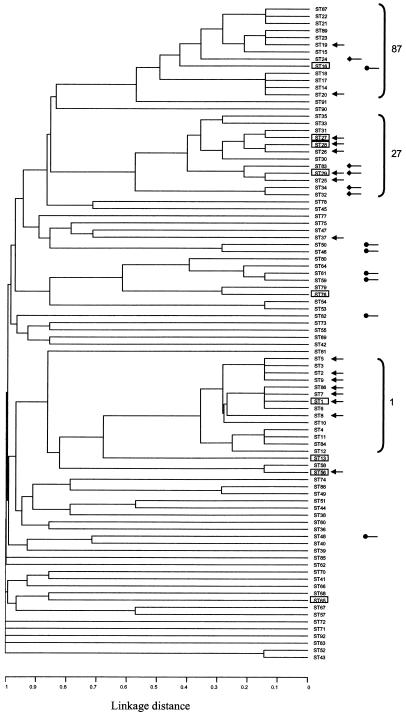
FIG. 2.
Distribution of serotypes relative to ST. The dendrogram shown in Fig. 1 is reduced to show only one member of each ST. STs representing isolates of multiple serotypes are boxed (see Table 3). •, distribution of serotype 9; ♦, distribution of serotype 7; arrows, distribution of serotype 2. STs belonging to the three major clonal complexes are bracketed.

