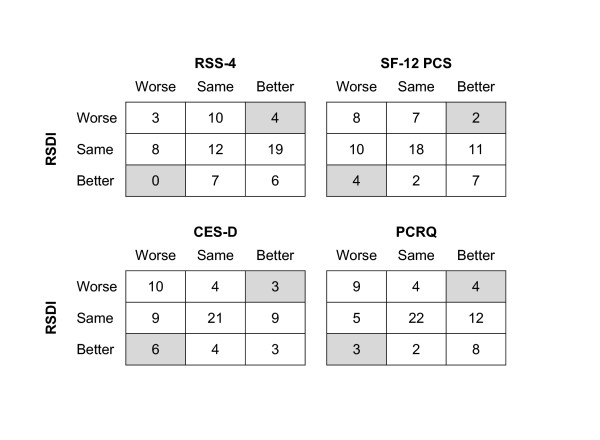
Figure 3.
Frequency counts for categorical change between the RSDI and other health status measures. Values represent the number of subjects within each category. Shaded cells indicate highly discordant change between measures. Overall, such discordance occurred in approximately one in every 10 subjects. Change in the RSDI was highly discordant in 6% of subjects for the RSS-4, 9% of subjects of the SF-12 PCS, 13% of subjects for the CES-D, and 10% of subjects for the PCRQ. For definitions of abbreviations see Table 2.

