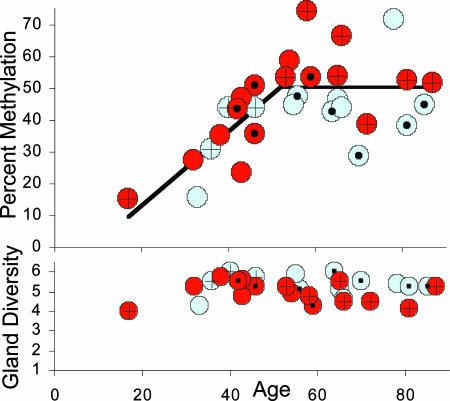
Fig. 3.
Average uterine percent methylation increased during menstruation (ages 12-52 years) and was relatively stable after menopause. A regression analysis of these data was consistent with two lines (as opposed to one; F1,27 = 10.55, P = 0.003), with methylation increasing up to age 52 years and no increase afterward (F1,27 = 0.33, P = 0.57). Red circles indicate two or fewer children; blue circles, three or more children; plus marks indicate obesity (BMI >30) and solid circles lean women (BMI <24). Average uterine gland diversity (numbers of unique tags among eight sampled tags) was stable with age. More complete graphs that include individual gland values are illustrated in Fig. 7, which is published as supporting information on the PNAS web site.

