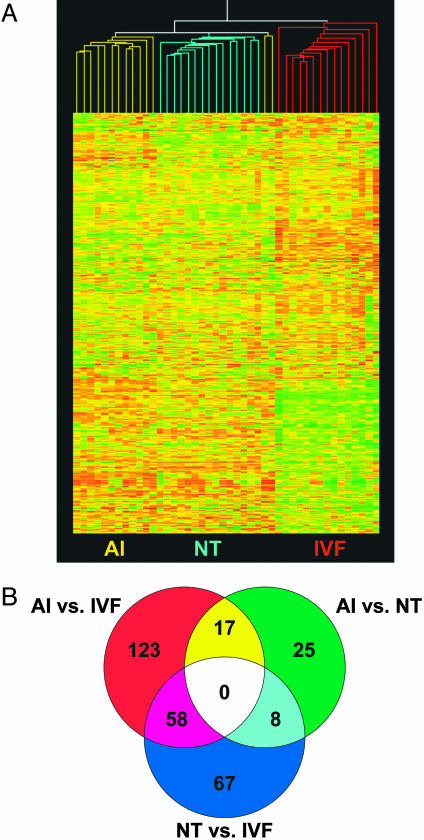
Fig. 2.
Hierarchical cluster of AI, NT, and IVF embryos and characterization of differentially expressed genes. (A)(Inset) The 5,174-gene cluster arranged to highlight differential gene expression in IVF embryos (red) as compared with both AI (yellow) and NT embryos (blue). (B) Venn diagram characterizing differential gene expression between and specific to individual embryo types. Each circle represents the differential expression between two embryo types out of 5,174 analyzed genes. The circle (upper right) shows the 50 genes that are differentially expressed between AI and NT embryos; 25 genes (green) are uniquely expressed in AI vs. NT only, 17 genes (yellow) are specific to AI embryos, and 8 genes (aqua) are NT-specific.

