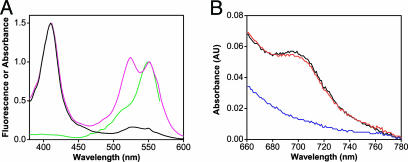
Fig. 2.
Characterization of TMR-cytochrome c by fluorescence and UV-visible spectroscopy. (A) Absorbance and fluorescence spectra of unlabeled and labeled cytochrome c. Normalized absorbance spectra of unlabeled cytochrome c (black) and cytochrome c labeled with a 2:1 molar ratio of TMR (magenta). The fluorescence excitation spectrum of TMR-cytochrome c (green) shows that the absorbance peak at 550 nm is fluorescent. (B) The 695-nm absorbance band of cytochrome c characteristic of Met-80 ligation is present at pH 7.0 (black) and is abolished at pH 9.5 (blue). Subsequent addition of HCl restores the 695-nm absorbance band (red).

