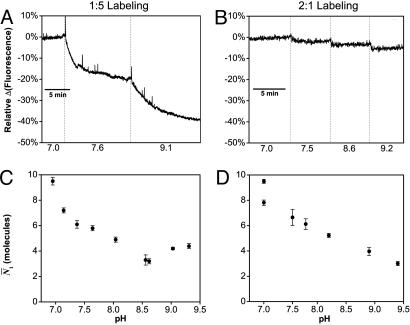
Fig. 6.
The alkaline transition of TMR-cytochrome c as observed by ensemble fluorometry (Upper) and PCH (Lower). (A and B) Cytochrome c labeled at the optimal ratio of 1:5 shows a 40% decrease in fluorescence for the alkaline transition (A), whereas that labeled with a 2:1 ratio shows only a 5% decrease because of background from nonfunctional protein (B). (C and D) Regardless of the background, the N̄1 parameter from PCH shows a decrease of similar magnitude (–56% and –68%) for samples labeled at molar ratios 1:5 (C) and 2:1 (D).

