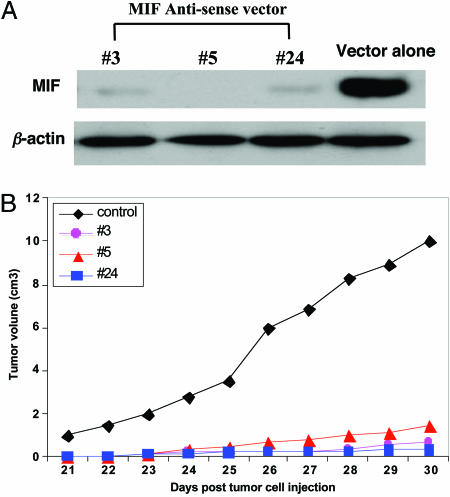
Fig. 2.
Effect of MIF suppression in vitro and in animal model. (A) Expression of MIF in control and MIF-suppressed neuroblastoma cells assessed by Western blot. (Upper) MIF has successfully been reduced compared with control. (Lower) Confirmation of the equivalent protein loading by using the house-keeping gene “β-actin” as internal control. (B) The average tumor growth curves for the MIF-reduced and control groups. The black curve indicates the control group (n = 10), and the three colored curves indicate the MIF-reduced group (total sample size, n = 30).

