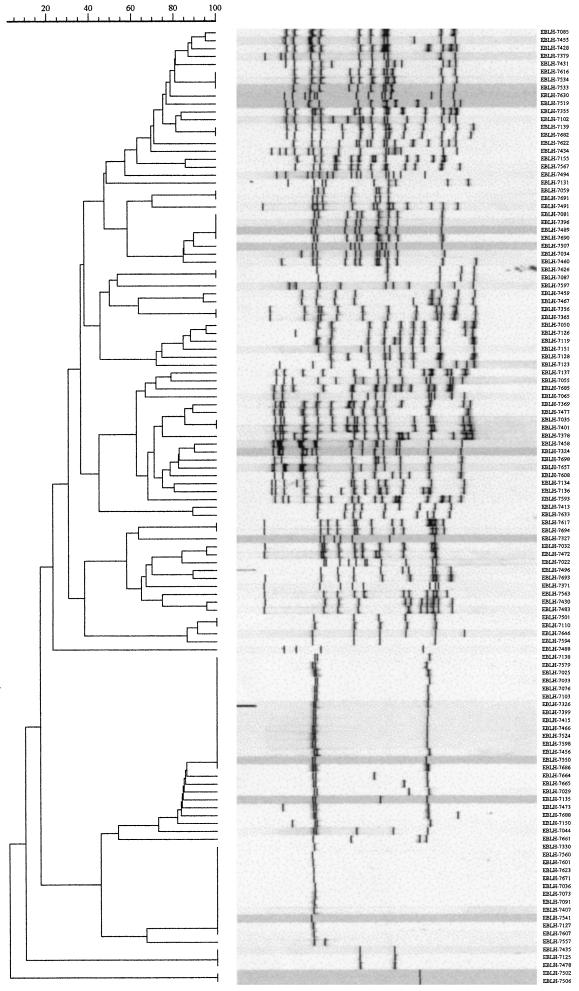
FIG. 2.
IS6110 banding patterns and similarity matrices for 121 M. tuberculosis isolates from Ethiopian patients with pulmonary TB. Banding patterns are ordered by similarity. The corresponding dendrograms are to the left of the panels. The positions of the bands in each lane are adjusted (normalized) so that the band positions for all strains are comparable. The scale depicts similarity coefficients (which are defined elsewhere [37]).

