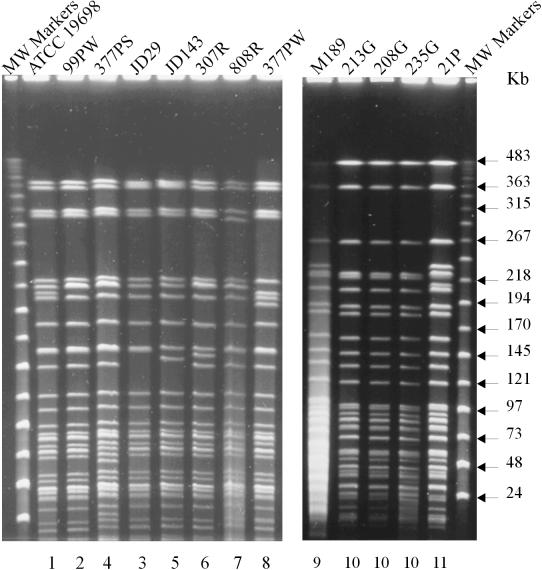
FIG. 2.
PFGE profiles of M. avium subsp. paratuberculosis isolates generated with SnaBI. (Left) Profiles of nonpigmented isolates; (right) profiles of pigmented ovine isolates. Numbers above the lanes are designations of isolates, details for which are given in Table 1. Numbers below the lanes represent the different PFGE SnaBI reference types. PFGE running conditions are described in Materials and Methods.

