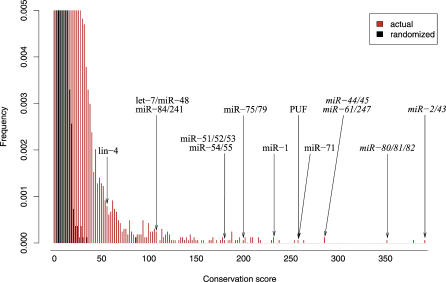
Figure 2. Distribution of Conservation Scores for the C. elegans/C. briggsae Analysis on 3′UTR Sequences.
Distributions of actual (red) and randomized (black) sequences are shown. Scores corresponding to some of the known miRNA target sites and RNA-binding protein sites in worms are indicated by arrows. The top portion of both distributions are not shown, for the purpose of presentation.

