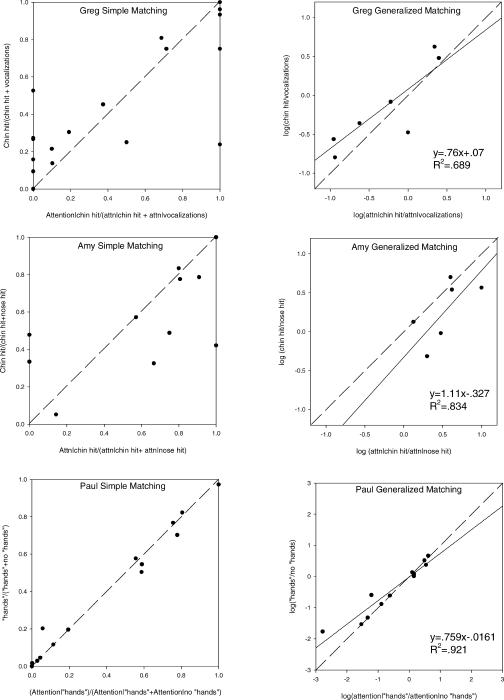
Figure 3. Results of simple and generalized matching equations for Greg, Amy, and Paul.
Each data point represents one 10-min descriptive observation block. In the left panels, the dashed line shows perfect matching, as predicted by the simple matching equation. The right panels show the results of the generalized matching equation (Equation 2). The dashed line depicts the allocation as predicted by the matching equation. The solid line is the best fitting line through the actual data points. Slope and bias are depicted in the linear equation.

