
Figure 4.
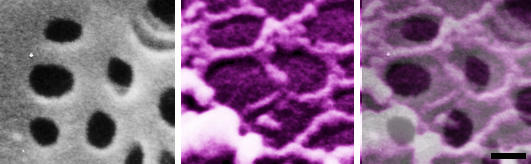
High-power scanning electron micrographs of a nonextracted (left); and of a formaldehyde prefixed, cytoskeleton buffer extrated rat liver sinusoidal endothelial cell (middle). Notice the grouped fenestrae on the cell surface (left); and a remarkable series of rings of fenestrae-associated cytoskeleton (middle). Layering a colored scanning electron micrograph on top of the cell surface of a nonextracted rat liver sinusoidal endothelial cell clearly illustrates the relation between both structures (right). Scale bar, 200 nm.