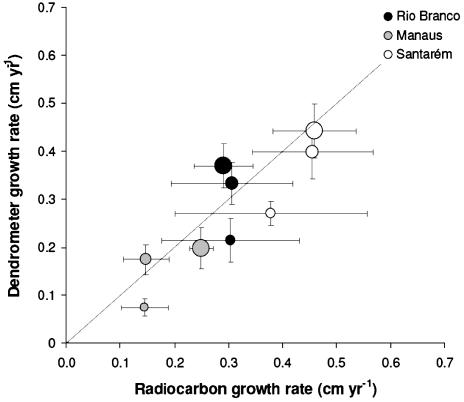
Fig. 2.
Mean tree growth rates (cm·yr-1) in three size classes derived from radiocarbon [(diameter divided by radiocarbon-derived age; ≈ 10) and annual dendrometer increment (average of 2-3 years of data; n ≈ 100 (18) except to Manaus (18)]. Circles of increasing size represent size classes of 10-30, 30-50, and >50 cm, respectively. The error bar in each case represents the SEM. Larger errors are associated with radiocarbon-based growth rates because fewer analyses were available.

