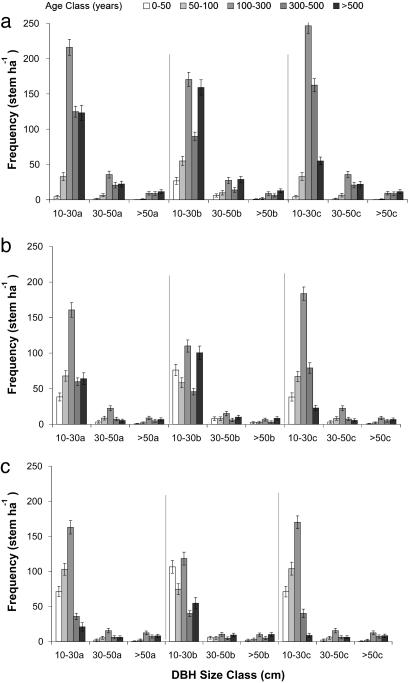
Fig. 4.
Distribution of tree ages (stem·ha-1 ± SD) in permanent plots in Manaus (a), Santarém (c), and Rio Branco (b). Ages are based on the Monte Carlo extrapolation of dendrometer-based growth rates for the three different size classes used: 0.65 times the standard deviation of the lognormal distribution when randomly assigning growth rates, minimum growth rate cutoff was 0.02 cm·yr-1 (a); 1.0 times the standard deviation of the lognormal distribution when randomly assigning growth rates, minimum growth rate cutoff was 0.02 cm·yr-1 (b); and 0.65 times the standard deviation of the lognormal distribution, minimum growth rate cutoff was 0.04 cm·yr-1 (c).

