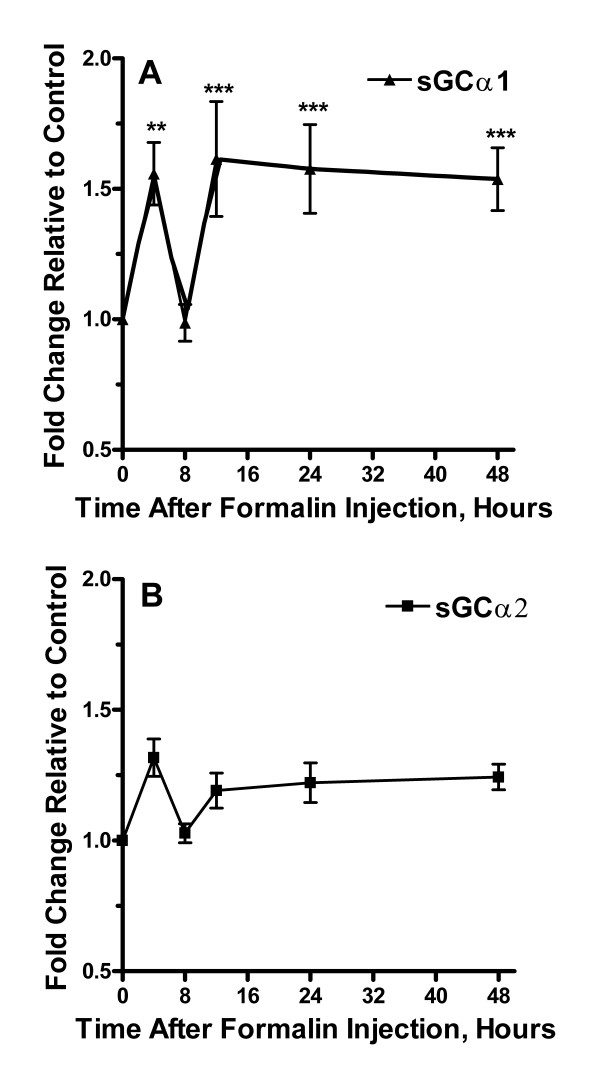
Figure 4.
Alterations in expression of sGC isoforms after the hind paw injection of formalin. Panel A provides a time course analysis of changes in levels of sGCα1 mRNA up to 48 hours after formalin injection relative to controls. Panel B summarizes these measurements for sGCα2 mRNA. Data are presented as mean values +/- S.E.M, *p < 0.05, **p < 0.01, ***p < 0.001.

