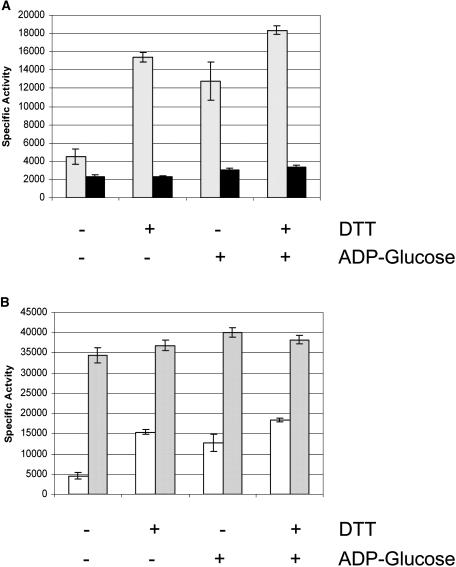
Figure 4.
Reduction of the disulfide bridge. Reactions were incubated for 15 min at room temperature in 20 μL of a mixture containing 100 mm HEPES, pH 7.4, 0.2 mg/mL BSA, 5 mm MgCl2, and the specified treatment listed. Following preincubation, reactions were performed using assay B with the following modification. The ADP-Glc concentration was adjusted from 2.0 mm so that the final concentration in all assays was 1.4 mm. The concentration of DTT used was 3.0 mm. Each assay was performed from 0 to 6 min and the slope of the velocity versus time plot was used to calculate the specific activity. A, Activity (μmol min−1 mg−1) in the absence of 3-PGA. Black bars represent wild-type and cross-hatching QTCL. B, Activity (μmol min−1 mg−1) of QTCL in the absence (white bars) or presence (gray bars) of 10 mm 3-PGA.

