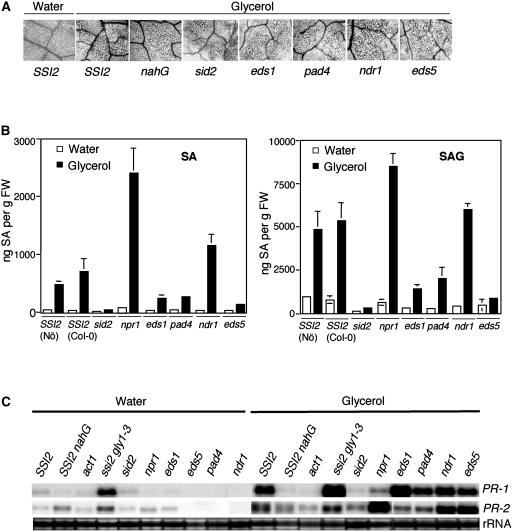
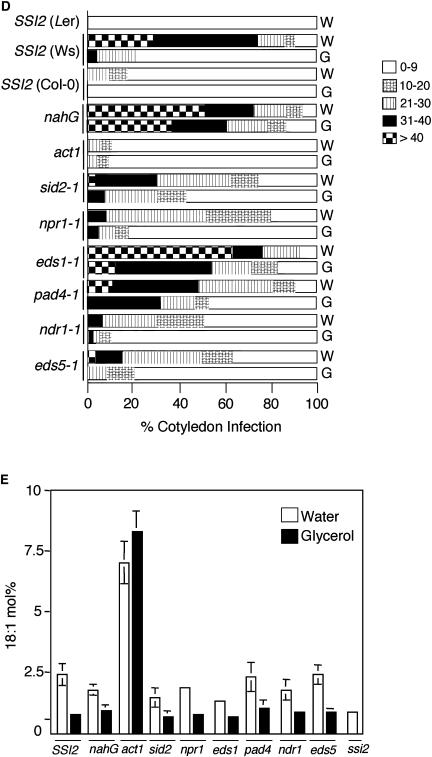
Figure 1.
Glycerol-mediated effects on mutants impaired in SA or R gene signaling. A, Microscopy of trypan blue-stained leaves from indicated genotypes treated with water or 50 mm glycerol. SSI2 indicates Col-0 ecotype. B, Endogenous SA and SAG levels in the leaves of indicated 4-week-old soil-grown plants treated with water or glycerol. The values are presented as the mean of three replicates. Error bars represent sd. C, Expression of the PR-1 and PR-2 genes in indicated genotypes. RNA gel-blot analysis was performed on 7 μg of total RNA extracted from 4-week-old soil-grown plants treated with water or glycerol. SSI2 indicates Col-0 ecotype. Ethidium bromide staining of rRNA was used as a loading control. D, Growth of P. parasitica biotype Emco5 on various plant genotypes listed at the left. The Ler and Ws ecotypes were used as the resistant and susceptible controls, respectively. The plants were treated with water (W) or glycerol (G) for 72 h prior to pathogen inoculation and approximately 60 to 75 cotyledons were scored for infection. The shade of each box indicates the severity of infection, based on the number of sporangiophores per cotyledon (see key at the right). Except eds1-1 (Ws background) and nahG (Nö background), all other mutant lines were in Col-0 background. E, Glycerol-induced changes in the 18:1 levels in leaf tissue of 4-week-old plants. Plants were treated with glycerol or water, and samples taken 72 h post treatment were analyzed for FAs using gas chromatography (GC). SSI2 indicates Col-0 ecotype. The values are presented as the mean of six to eight replicates. Error bars represent sd.


