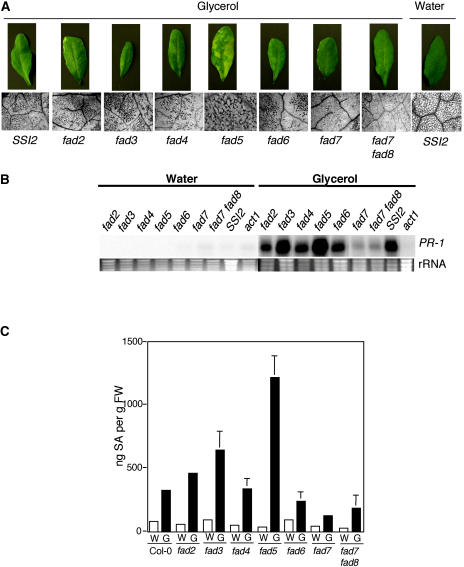
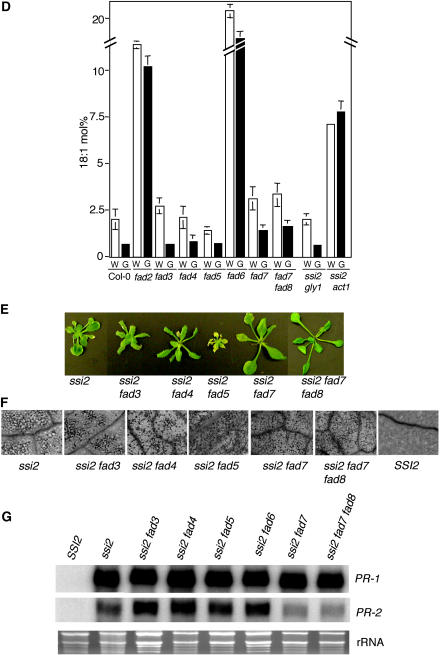
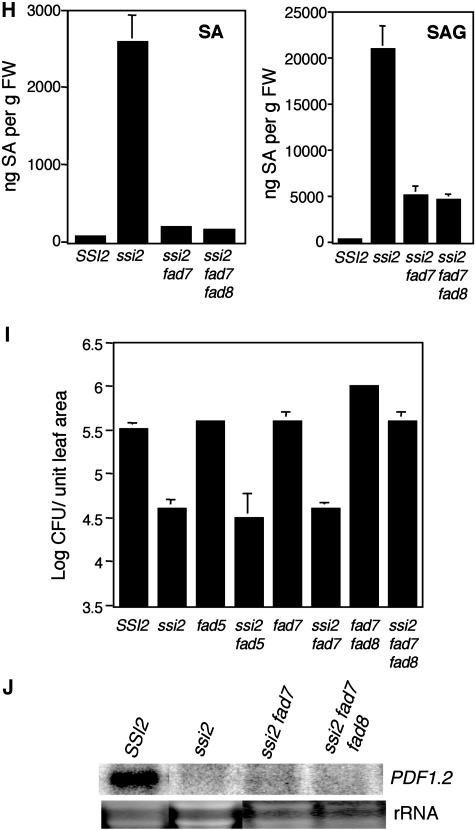
Figure 3.
Glycerol-mediated effects on mutants impaired in various FAD steps and double-mutant analysis of ssi2 in different fad backgrounds. A, Comparison of the morphological and cell death phenotypes displayed by the wild-type (SSI2, Col-0 ecotype), fad2, fad3, fad4, fad5, fad6, fad7, and fad7 fad8 plants. The plants were treated with water or glycerol and photographed 3 d post treatment. B, Expression of the PR-1 gene in water- and glycerol-treated fads, wild-type (SSI2, Col-0 ecotype), and act1 plants. RNA gel-blot analysis was performed on 7 μg of total RNA extracted from 4-week-old soil-grown plants. Ethidium bromide staining of rRNA was used as a loading control. C, Endogenous SA levels in the leaves of 4-week-old soil-grown wild-type (Col-0), fad2, fad3, fad4, fad5, fad6, fad7, and fad7 fad8 plants treated with water (W) or glycerol (G). The values are presented as the mean of three replicates. Error bars represent sd. D, Glycerol-induced changes in the 18:1 levels in leaf tissue of 4-week-old plants. The ssi2 gly1 and ssi2 act1 plants were used as controls. Plants were treated with glycerol (G) or water (W), and samples taken 72 h post treatment were analyzed for FAs using GC. The values are presented as the mean of six to eight replicates. Error bars represent sd. E, Comparison of the morphological phenotypes displayed by the ssi2 and various ssi2 fad double- and triple-mutant plants. F, Microscopy of trypan blue-stained leaves from ssi2 and various ssi2 fad double- and triple-mutant plants. G, Expression of the PR-1 and PR-2 genes in wild-type (SSI2, Nö ecotype), ssi2, and various ssi2 fad double- and triple-mutant plants. RNA gel-blot analysis was performed on 7 μg of total RNA extracted from 4-week-old soil-grown plants. Ethidium bromide staining of rRNA was used as a loading control. H, Endogenous SA and SAG levels in the leaves of 4-week-old soil-grown SSI2 (Col-0), ssi2, ssi2 fad7, and ssi2 fad7 fad8 plants. Values are presented as the mean of three replicates. Error bars represent sd. I, Growth of P. syringae on SSI2, ssi2, fad5, ssi2 fad5, fad7, ssi2 fad7, fad7 fad8, and ssi2 fad7 fad8. Four leaf discs were harvested from infected leaves at 3 d postinoculation, ground in 10 mm MgCl2, and the bacterial numbers tittered. The bacterial numbers ± sd (n = 4) presented as colony forming units (CFU) per unit leaf area of 25 mm2. The experiment was independently performed twice with similar results. J, Expression of the PDF1.2 gene in SSI2, ssi2, ssi2 fad7, and ssi2 fad7 fad8 plants in response to 50 μm JA. Samples were harvested 48 h post treatment and analyzed by RNA gel-blot analysis performed on 7 μg of total RNA. Ethidium bromide staining of rRNA was used as a loading control.


