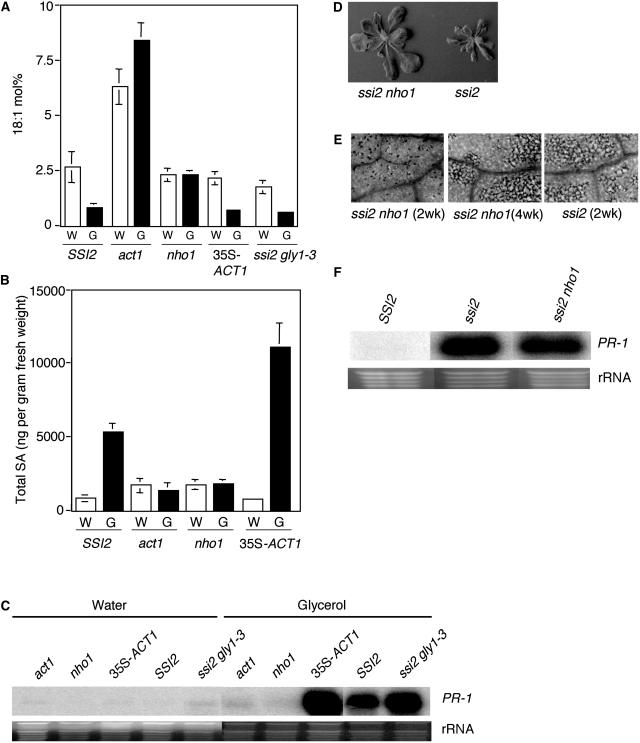
Figure 6.
Comparison of glycerol-responsiveness in wild-type, act1, nho1, ssi2 gly1-3, and 35S-ACT1 plants and double-mutant analysis of ssi2 nho1 plants. A, Glycerol-induced changes in the 18:1 levels in leaf tissue of 4-week-old plants. Plants were treated with glycerol (G) or water (W) and samples taken 72 h post treatment were analyzed for 18:1 content using GC. The values shown are an average of six independent replicates. Error bars represent sd. B, Endogenous SA levels in the leaves of 4-week-old soil-grown plants. SSI2 indicates Col-0 ecotype. The values presented are averages of three replicates. Error bars represent sd. C, Expression of the PR-1 gene in water- and glycerol-treated plants. RNA gel-blot analysis was performed on 7 μg of total RNA extracted 72 h after glycerol treatment. The ssi2 gly1-3 plants used in this study were 3 weeks old. Ethidium bromide staining of rRNA was used as a loading control. D, Comparison of the morphological phenotypes displayed by the 16-d-old soil-grown ssi2 and ssi2 nho1 plants. E, Microscopy of trypan blue-stained leaves from ssi2 and various ssi2 nho1 plants. F, Expression of the PR-1 gene in ssi2 and ssi2 nho1 plants. RNA gel-blot analysis was performed on 7 μg of total RNA extracted from 16-d-old soil-grown plants. Ethidium bromide staining of rRNA was used as a loading control.

