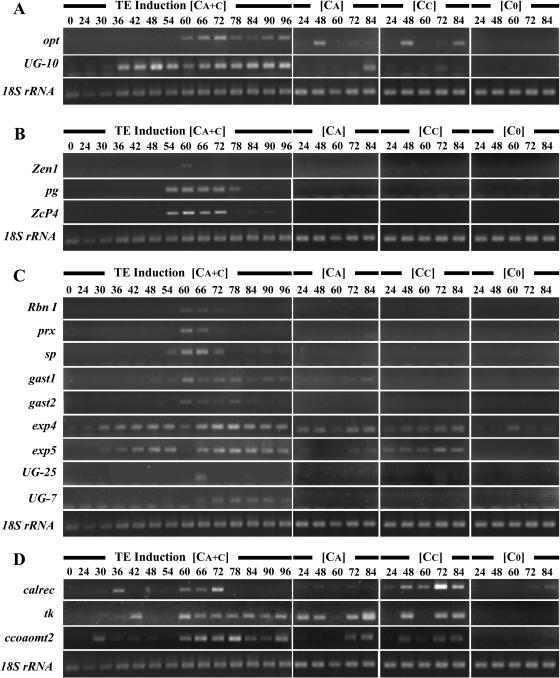
Figure 9.
RT-PCR expression analysis of genes from the four different temporal expression clusters. Genes from cluster A are presented in A, genes from cluster B in B, and so on. Cells were cultured for different amounts of time in TE induction medium (CA + C), basal medium without hormones (C0), or in the presence of either naphthylacetic acid (CA), or benzylaminopurine alone (CC).

