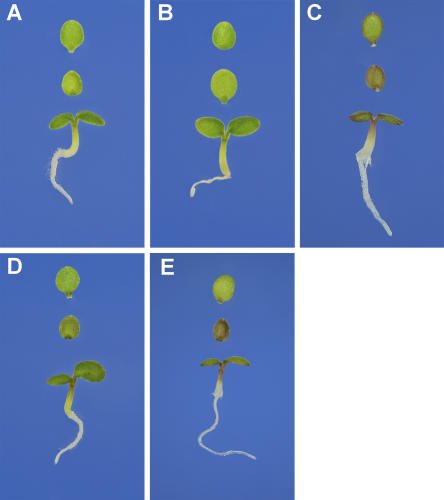
Figure 7.
Genetic analysis shows that the SIAA1 locus represents MYB75/PAP1. Coloration of seedlings derived from crosses between pst16228 × Cvi (A), Cvi × pst16228 (B), Cvi × NaeAc380-16 (C), Cvi × Ds3-390-1 (D), and pst16228 × Ler (E). Seedlings were grown on one-half-strength MS medium containing 100 mm Suc for 3 to 5 d. Top, Adaxial view of cotyledon; middle, abaxial view of cotyledon; bottom, whole seedling.

