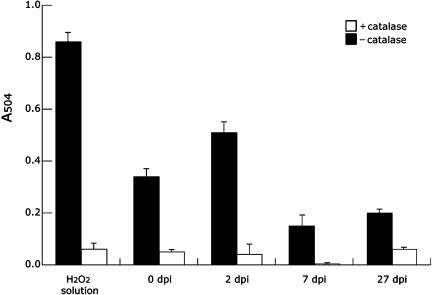
Figure 6.
ROS production in nodules 0, 2, 7, and 27 dpi. Data are means and sds of the means of three independent experiments. Black bars show ROS levels in the root/root nodules at different stages of nodule development, whereas the white bars refer to catalase-treated samples as negative controls. The H2O2 sample with and without catalase treatment also served as control. A504, A504.

