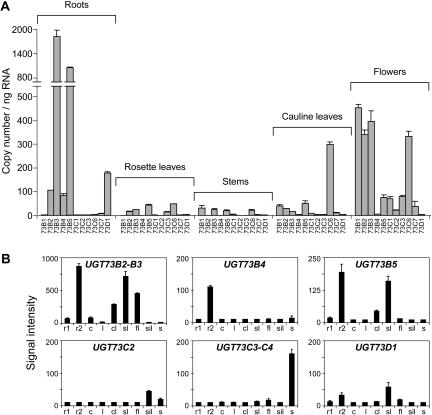
Figure 7.
Expression of UGT D genes in Arabidopsis tissues. A, RT-qPCR analysis of UGT expression in roots, rosette leaves, stems, cauline leaves, and flowers. The transcript level of each gene is expressed in absolute copy number per ng total RNA. Values correspond to the mean and sd of duplicates. B, Expression of UGT D genes in soil-grown roots (r1), Murashige and Skoog-grown roots (r2), cotyledons (c), leaves (l), cauline leaves (cl), senescent leaves (sl), flowers (fl), siliques (sil), and seeds (s). Gene expression level, obtained from the AtGenExpress microarray datasets, are expressed in an arbitrary unit. Values correspond to mean and sd of triplicates.

