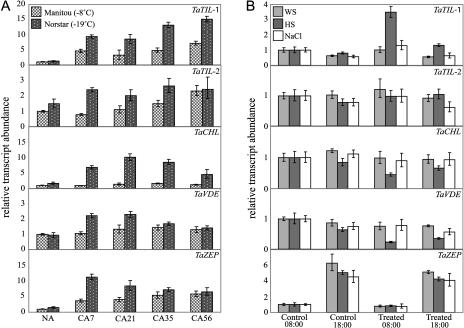
Figure 3.
Expression analysis of wheat lipocalins in response to abiotic stresses. Plants were treated, then total RNA was isolated from leaves, reverse transcribed, and subjected to quantitative real-time PCR. Relative transcript abundance was calculated and normalized with respect to the 18S rRNA transcript level. Data shown represent mean values obtained from four independent amplification reactions (n = 4), and the error bars indicate the range of possible RQ values defined by the se of the delta threshold cycles (Cts). This experiment was repeated three times with similar results. A, Expression during CA of wheat seedlings. Tissues were sampled at 18:00. Spring wheat (T. aestivum L. cv Manitou; LT50 of −8°C) and winter wheat (T. aestivum L. cv Norstar; LT50 −19°C) were cold acclimated at 4°C for the indicated number of days. NA, Nonacclimated plants grown for 7 d; CA7 to CA56, plants cold acclimated for 7 to 56 d. B, Expression following exposure of wheat seedlings to abiotic stresses. Winter wheat (T. aestivum L. cv Norstar; LT50 −19°C) plants were treated as follows: WS, dehydrated in a 30% polyethylene glycol solution (water stress); HS, exposed to 40°C for 1 h (heat shock); and NaCl, treated with 300 mm NaCl for 12 and 22 h (salt stress). The sampling time (08:00 and 18:00) indicates treatment periods of 12 and 22 h, respectively.

