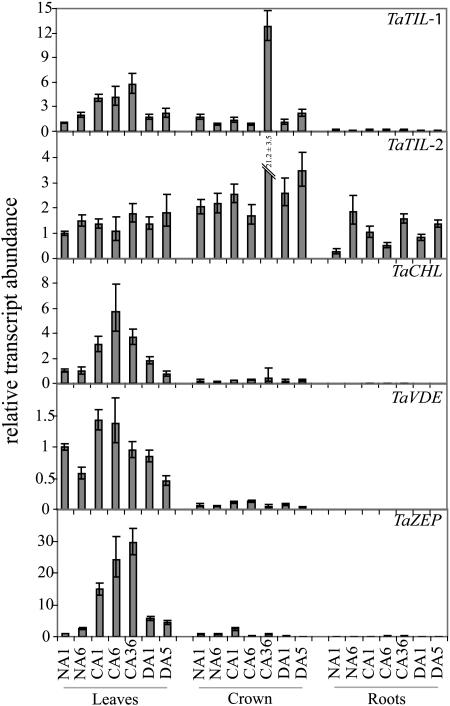
Figure 5.
Expression analysis of wheat lipocalins in different tissues. Plants were grown for 7 d at 20°C. Nonacclimated (NA) control plants were maintained at 20°C for 1 and 6 d. Cold-acclimated (CA) plants were transferred at 4°C for 1, 6, and 36 d. After CA, some plants were transferred at 20°C for 1 and 5 d for deacclimation (DA). Leaf, crown, and root tissues were sampled at 18:00 and RNA was extracted and analyzed as described in Figure 3.

