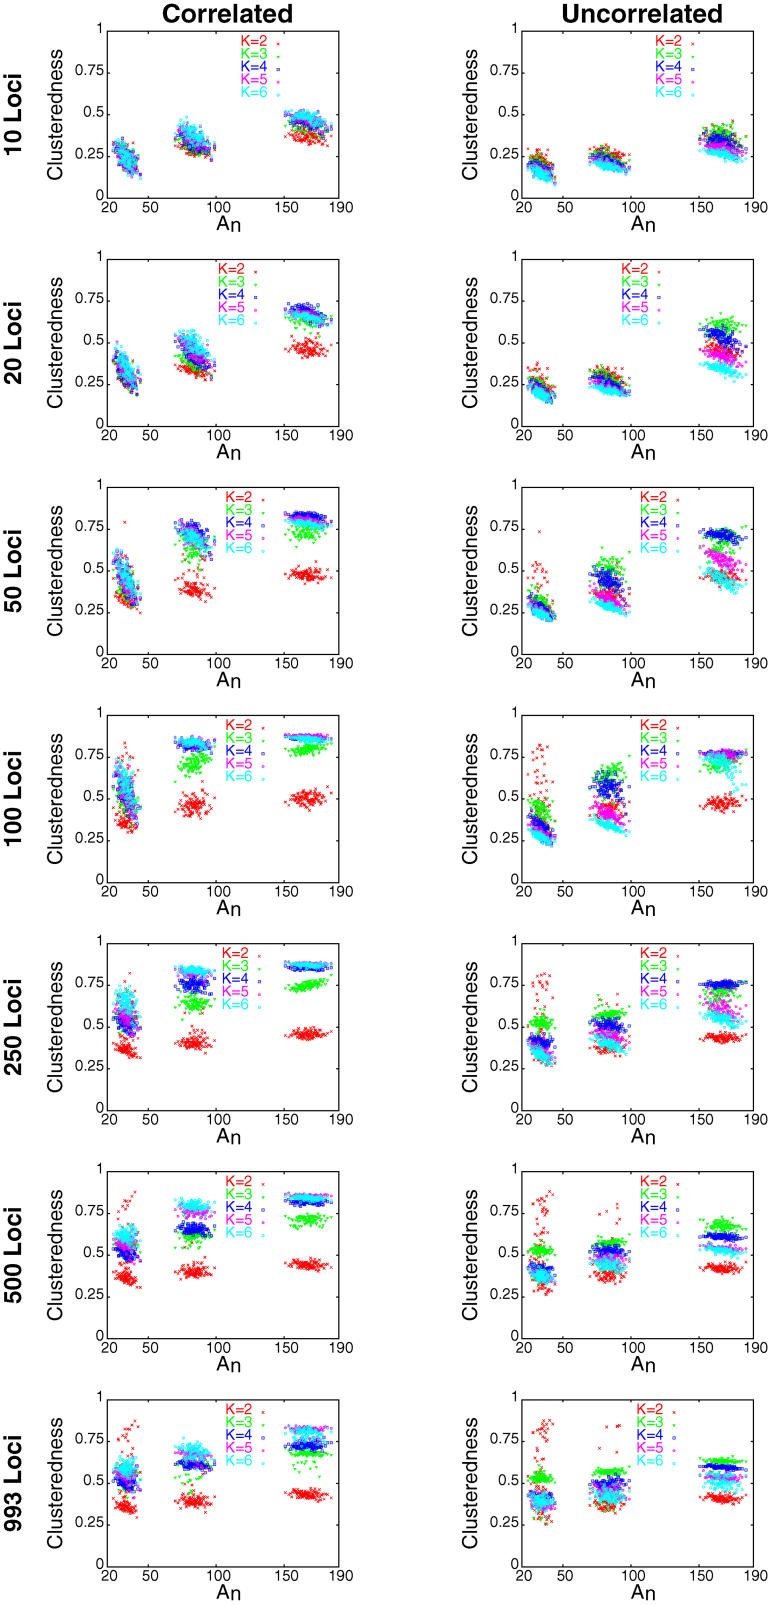
Figure 4. Mean Clusteredness versus Geographic Dispersion as Measured by An .
Each point shows the mean clusteredness of 20 runs with the specified number of loci and allele frequency correlation model: two replicates for each of ten sets of loci (for 993 loci, it is the mean of two runs, as only one set of loci was used). From left to right, the three groups of points in each plot respectively represent sets of 100, 250, and 500 individuals.

