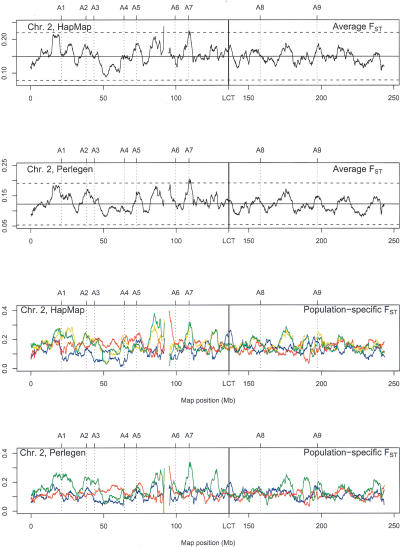
Figure 6.
Human chromosome 2 values of FST from HapMap and Perlegen data. For population-specific values, the HapMap populations are CEU (blue), YRI (red), CHB (green), and JPT (yellow). The Perlegen populations are EA (blue), AA (red), and HC (green). The genes A1–A9 are: A1: APOB; A2: FAM82A (formerly LOC151393); A3: THADA (formerly FLJ21877); A4: PELI1; A5: SEC15L2 (formerly SEC15B); A6: REVIL; A7: EDAR; A8: GALNT5; A9: HECW2 (formerly KIAA1301) as described in Supplemental Table A of Akey et al. (2002).

