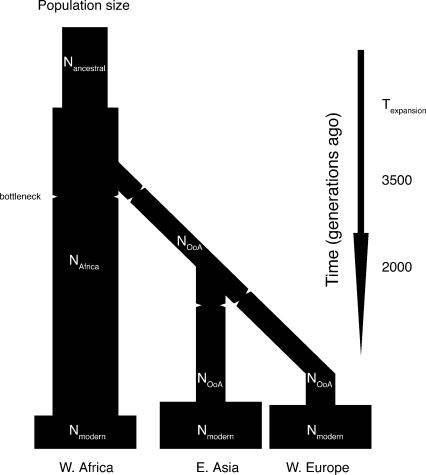
Figure 3.
Demographic model. N1: ancestral population size. (N2) African population size. (N3) non-African population size. (Texp) Time of ancestral population expansion (if any). Bottlenecks are indicated by constrictions. (Not shown: recurring migration between African and European populations, and between Asian and African populations.)

