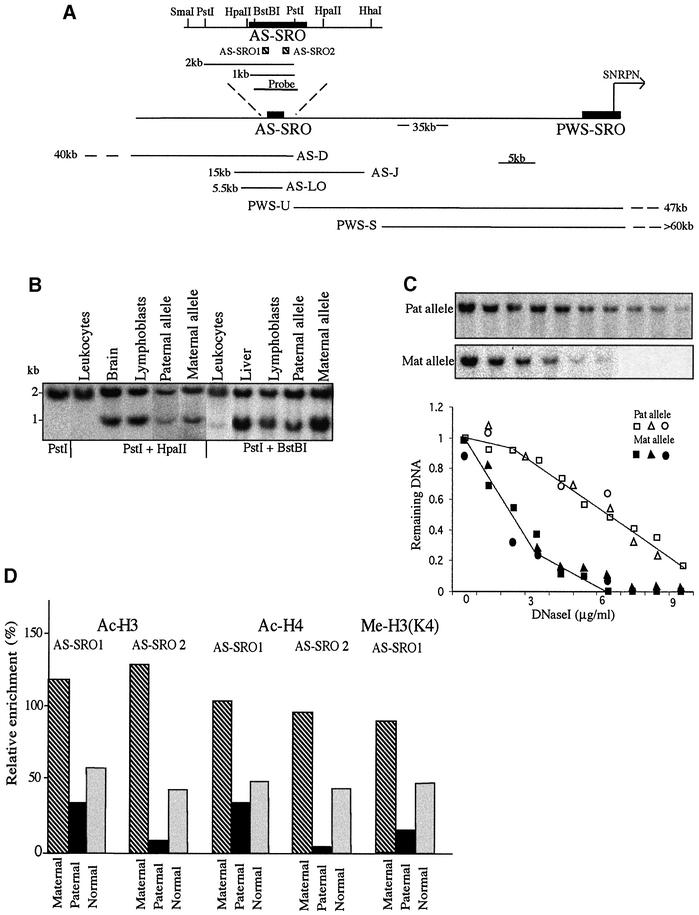
Fig. 1. Epigenetic features of the AS-SRO. (A) Physical map of the AS-SRO and PWS-SRO regions showing restriction sites, the sizes of expected fragments, the positions and extent (kb) of the deletions in the families studied, the AS-SRO probe, the SNRPN transcription start site (horizontal arrow) and the approximate distance between the SNRPN transcription start site and the AS-SRO (Buiting et al., 1999). (B) Southern blot analyses of the AS-SRO methylation pattern in DNA from leukocytes, lymphoblasts, sperm and brain of normal individuals. To demonstrate the methylation status of the paternal allele, DNA from lymphoblasts of an AS patient was used, and the methylation of the maternal allele was tested on lymphoblast DNA of a patient’s mother. DNA samples were digested with PstI alone, PstI + HpaII or PstI + BstBI, electrophoresed, blotted and hybridized with the 1 kb AS-SRO probe. This measures the methylation status of the 5′ HpaII and BstBI sites. The 2 kb band represents the methylated allele while the ∼1 kb band represents the unmethylated allele. The upstream SmaI and downstream HpaII and HhaI sites were also found to be partially methylated biallelically (data not shown). (C) DNase I sensitivity. Nuclei prepared from lymphoblasts of AS-D, AS-J or AS-LO family members including both the AS patient himself (intact paternal allele) and his mother (intact maternal allele) were treated with increasing concentrations of DNase I (0–0.9 µg/ml) and the resulting DNA digested with PstI, Southern blotted and hybridized with the 1 kb AS-SRO probe. A sample blot shows results from the AS-D family. Blots from all of the families (AS-D, squares; AS-J, triangles; AS-LO, circles) were scanned and the data normalized and plotted to show the kinetics of DNase I digestion. (D) Histone H3 and H4 acetylation or H3 Lys4 methylation in the AS-SRO region was determined by ChIP. PCR amplification was carried out on bound and input DNA from lymphoblast mononucleosomes of the AS-D family containing either the maternal (hatched) or paternal (black) allele and normal cells (gray) using primer pairs that amplify two different regions, representing the 5′ part (AS-SRO1) and the 3′ part (AS-SRO2) of the AS-SRO region [see diagram in (A)]. Relative enrichment was calculated with respect to that obtained with GAPDH (defined as 100%).

An official website of the United States government
Here's how you know
Official websites use .gov
A
.gov website belongs to an official
government organization in the United States.
Secure .gov websites use HTTPS
A lock (
) or https:// means you've safely
connected to the .gov website. Share sensitive
information only on official, secure websites.
