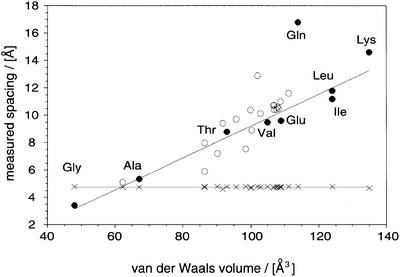
Fig. 4. Comparison of the internal structure of PAA fibrils and other amyloid structures. Correlation of the main chain spacing (crosses) and the side chain spacing (circles) with the residual volume (Creighton, 1993). Closed symbols, PAAs (Arnott et al., 1967; Komoto et al., 1974; Lotz, 1974; Perutz et al., 1994); open symbols, heterogeneous sequences (Glenner et al., 1974; Inouye et al., 1993, 2000; Nguyen et al., 1995; Weaver, et al., 1996; Symmons et al., 1997; Kirschner et al., 1998; Malinchik et al., 1998; Groß et al., 1999; Luckey et al., 2000; Serpell et al., 2000). A linear fit to the PAA side chain spacings (excluding glutamine) is shown.

An official website of the United States government
Here's how you know
Official websites use .gov
A
.gov website belongs to an official
government organization in the United States.
Secure .gov websites use HTTPS
A lock (
) or https:// means you've safely
connected to the .gov website. Share sensitive
information only on official, secure websites.
