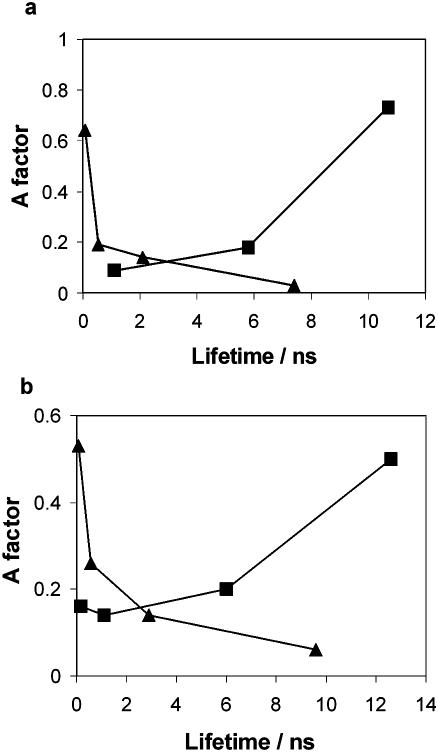
Figure 4.
Graphical representation of the characteristic response of the AP fluorescence decay parameters to base flipping. (a) Plot of fractional amplitude (A factor) versus lifetime for the crystalline complexes APout–M.HhaI–AdoHcy (triangles) and APtarget–M.HhaI–AdoHcy (squares). (b) Plot of A factor versus lifetime for the free APtarget duplex (triangles), the APtarget–M.HhaI (T250G)–AdoMet complex (squares) in aqueous solution.

