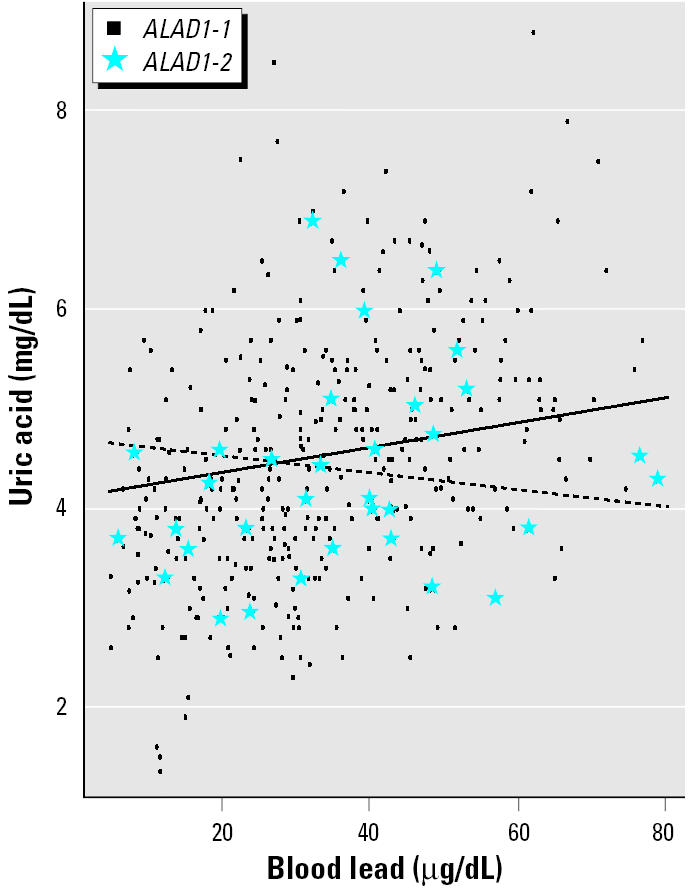
Figure 1.

Plot of model assessing effect modification by ALAD genotype on the association of blood lead and uric acid in Korean lead workers whose ages are ≥ 40.6 years (Table 3, panel 2). Regression lines, generated using mean values of covariates in the model (age, sex, BMI, and alcohol use), are overlaid on crude data. The solid regression line represents the adjusted relation between blood lead and uric acid in older participants with the ALAD1-1 genotype (circles); the dashed regression line represents the adjusted relation between blood lead and uric acid in older participants with the ALAD1-2 genotype (stars).
