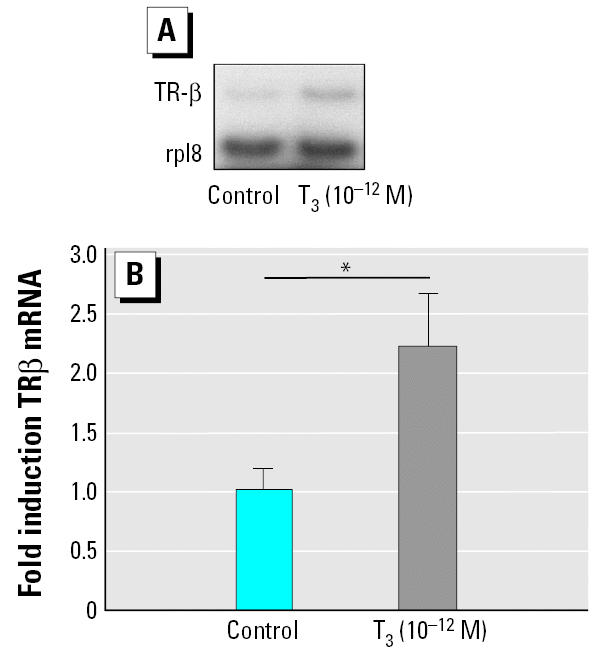
Figure 2.

Induction of TR-β expression by a weak T3 pulse. To evaluate the effect of the pretreatment protocol on TR-β expression, tadpoles were exposed for 6 hr to 10−12 M T3. Total RNA was extracted from caudal muscles and used for RT-PCR analysis of TR-β expression. Rpl8 was used as the internal control. (A) Typical scan obtained after 22 cycles of PCR amplification. (B) Same results quantified by Phosphoimager scanning (Molecular Dynamics, Sunnyvale, CA, USA). Values shown are mean ± SE of five independent experiments expressed as multiples of induction, where 1 is equal to expression in the absence of T3 (untreated tadpole; Rpl8) as the control level. For each sample, densitometry readings were normalized against the value for Rpl8.
*p < 0.05.
