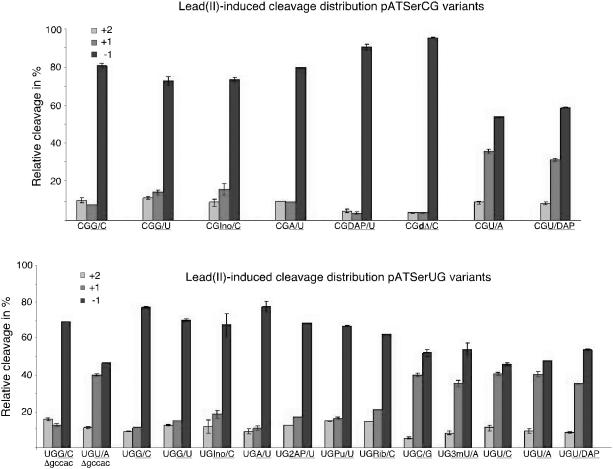
Figure 2.
Histograms showing Pb2+-induced cleavage of the different substrates in the absence of RNase P RNA as indicated. The distribution of the frequency of cleavage at −1, +1 and +2 were calculated and the relative distribution in percent was plotted as indicated. Δgccac indicate residues that were deleted in these pATSerUG derivatives as illustrated in Figure 1.

