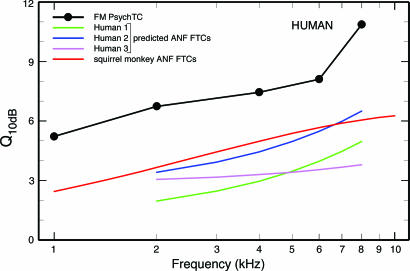
Fig. 5.
Sharpness of PsychTCs in humans and ANFTCs in humans and monkey. Shown are Q10-vs.-frequency curves for human ANFTCs derived from equations 3 (green), 4 (blue), and 5 (magenta and the fit line for APTCs in humans (Fig. 3). For comparison, also shown are the Q10 values of ANFTCs measured in squirrel monkey (red), reproduced from Fig. 2, and the Q10 values of FM PsychTCs in humans, derived from figure 6 of ref. 14.

