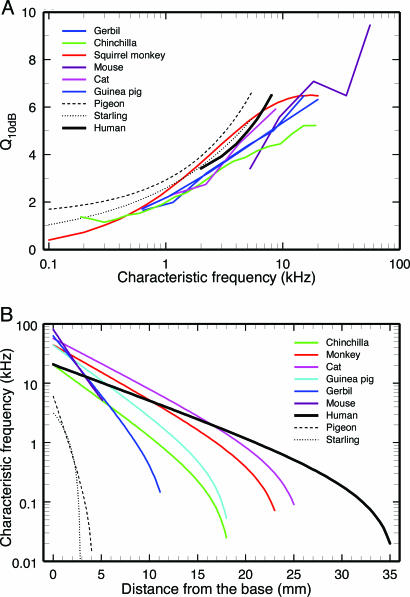
Fig. 6.
Similarity of frequency tuning of cochlear neurons of several species despite large differences in the cochlear maps. (A) Q10 values of cochlear neurons of experimental animals are compared with the largest predicted Q10 values for the ANFTCs of humans (reproduced from the blue curve of Fig. 5). (B) Cochlear maps for several mammalian and avian species, including humans. Data for most animals are from ref. 67; data for starling are from ref. 68, and data for pigeon are from ref. 69.

