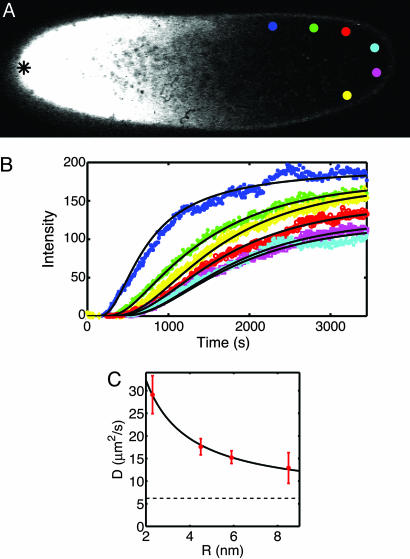
Fig. 1.
Diffusion of inert molecules in the Drosophila embryo. (A) Two-photon image of a wild-type D. melanogaster embryo 8 min after injection of fluorescently labeled dextran molecules at the mid-plane of the embryo. The tip of the glass micropipette used for the injection is located at the anterior pole (black asterisk on the left side of the image). Colored discs show areas where fluorescence intensity was analyzed. (B) Changes in the fluorescence intensity with time for the six color-corresponding discs in A, extracted from a time series of images taken with a frame rate of 8 s. Solid lines represent the time courses computed from the best fit of a numerical 3D diffusion model. Note that 18 curves (6 per focal plane) are fit by the solutions of the same diffusion equation, with only a single free parameter, the diffusion constant D. (C) Diffusion coefficients of dextran molecules of different hydrodynamic radii (red dots). The solid line represents diffusion coefficients expected from the modified Stokes–Einstein relation (10), D = kBT/(6π ηR) + b, with a viscosity η = 4.1 ± 0.4 cP and b = 6.2 ± 1.0 μm2/s; dashed line is at the value of b.

