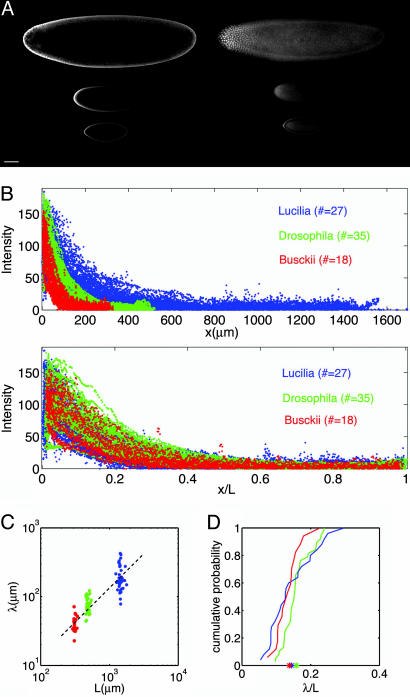
Fig. 3.
Scaling of Bcd profiles. (A) Typical confocal images of Bcd immunofluorescence staining for L. sericata (top), D. melanogaster (middle), and D. busckii (bottom). The focal plane is at mid-embryo and top-embryo in the left and right columns, respectively. (Scale bar: 100 μm.) (B) Intensity profiles of Bcd fluorescence of 27 L. sericata (blue), 35 D. melanogaster (red), and 18 D. busckii (green) embryos. The abscissa in Upper is absolute; the abscissa in Lower is relative to egg length. (C) Length constants λ as a function of egg length for L. sericata (blue), D. melanogaster (red), and D. busckii (green). (D) Cumulative probability distributions of length constants λ for L. sericata (blue), D. melanogaster (red), and D. busckii (green). Asterisks indicate the means of the three distributions.

