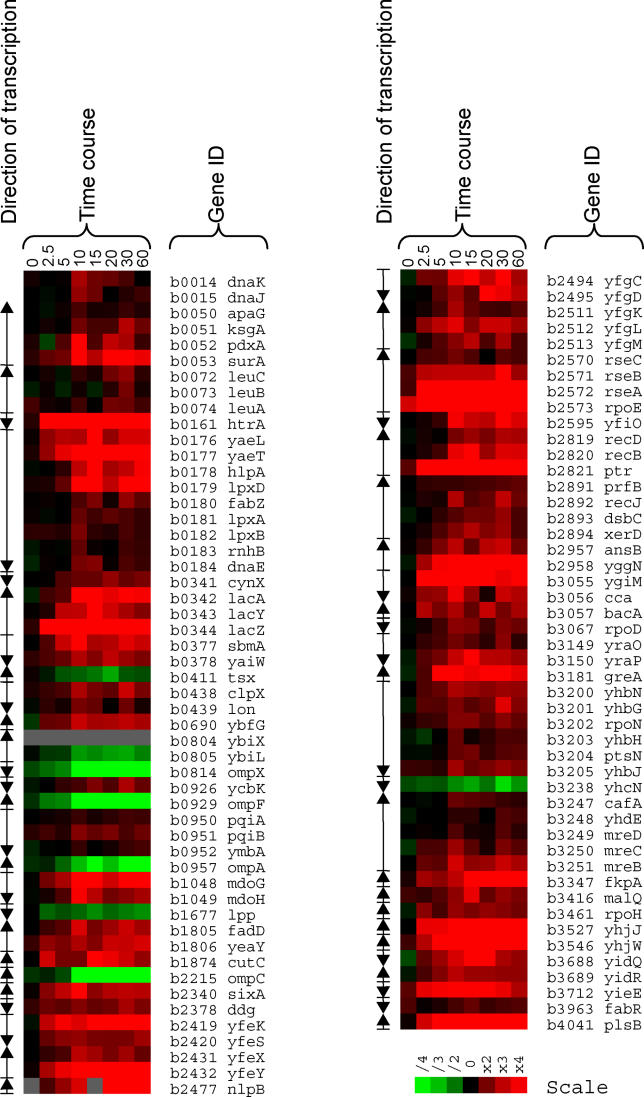
Figure 1. Expression Profiles of σE Regulon Members.
Significantly regulated genes identified from genome-wide transcription profiling following comparison of rpoE overexpressed (CAG25197) versus wild-type (CAG25196) E. coli K-12 MG1655 cells. The color chart illustrates the expression level for each gene from an average of four time-course experiments (see Materials and Methods). Red denotes induced, and green denotes repressed genes in CAG25197 following rpoE induction. Fold change of mRNA levels (rpoE overexpressed/wild-type) is indicated by the scale at the bottom of the figure; time in minutes after induction of rpoE in the time-course experiments is indicated at the top of the figure. Genes are identified by their unique ID and name (Gene ID) and are listed in chromosomal order to illustrate the TUs; the direction of transcription is indicated.

