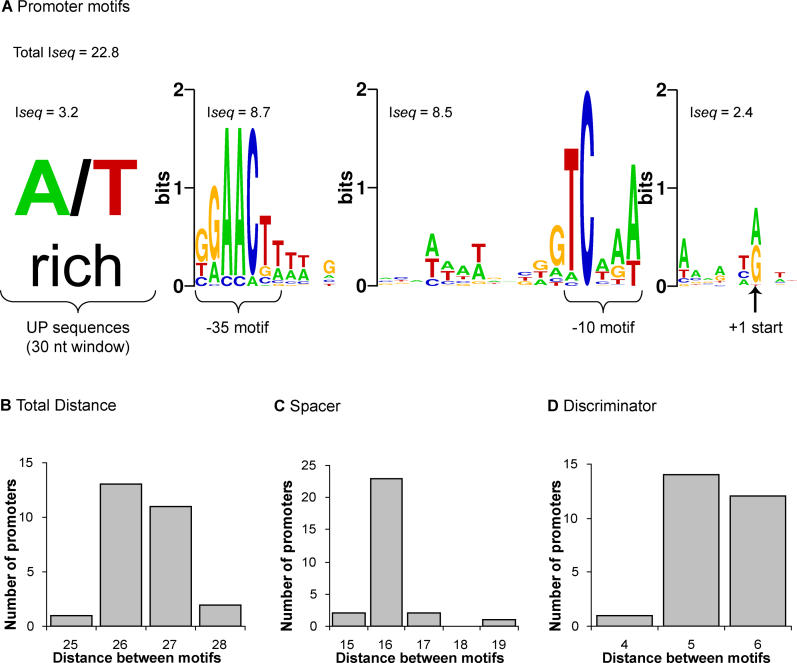
Figure 2. Sequence Logos and Spacer Histograms of σE Promoter Motifs.
Motifs were identified upstream of the 28 mapped transcription starts in E. coli K-12.
(A) Sequence logos (http://weblogo.berkeley.edu/; [78]) of the −35, −10, and +1 start site motifs and the A/T rich UP sequences. The information content (Iseq) of each motif is indicated (see Materials and Methods).
(B–D) Histograms of the number of promoters versus distances between the motifs identified in (A): (B) +1 start and −35 motifs; (C) −10 and −35 motifs; and (D) +1 start and −10 motifs. Distances between the −35, −10, and +1 start motifs are from the conserved GGAACTT, TCAAA, and A/G sequences, respectively, as marked in (A). Note that the weakly conserved spacer sequence appeared to associate with the −10 motif and was therefore incorporated into PWM−10.

