Figure 5.
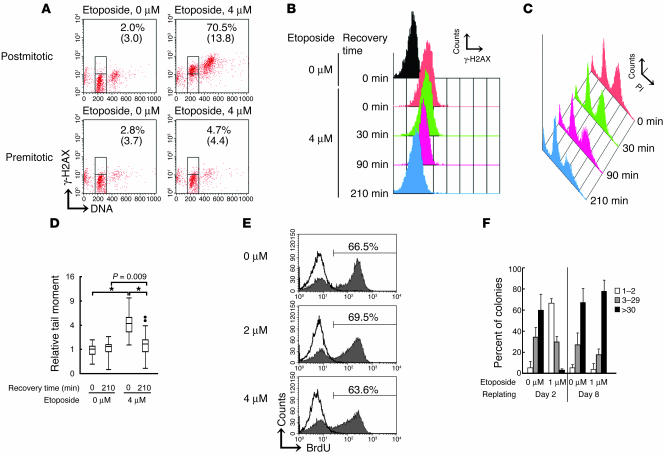
DNA DSBs are repaired in the postmitotic G1 phase. (A) Flow cytometric analysis for γ-H2AX and DNA content. Cells were analyzed in mock- or 4 μM etoposide–treated postmitotic G1-rich and premitotic G1-rich fractions. The percentages of γ-H2AX–positive cells and geometric mean values of γ-H2AX intensity of G1 phase cells are indicated. (B) Sequential analysis of γ-H2AX intensity of postmitotic G1 cells. (C) DNA contents of the postmitotic G1-rich fraction at various recovery time points. Apoptotic cell population as identified by subdiploid DNA contents showed no significant difference. (D) Neutral comet assay for mock- or 4 μM etoposide–treated postmitotic G1-rich fraction at time 0 or 210 minutes after recovery. Relative tail moment (1 = the average of the tail moment of untreated cells at 0 minutes) was calculated, and data are shown in the box-and-whisker plot (n = 70 for each). Outliers are indicated as dots. The ordinate is a square-root scale. *P < 0.0001 for overall homogeneity by the Kruskal-Wallis test; P values are adjusted for multiple comparisons by the Bonferroni-Holm method. (E) BrdU incorporation of postmitotic G1 cells. Cells were pretreated with the indicated concentrations of etoposide. Filled histograms, cells incubated without blocking by thymidine; open histograms, cells incubated with blocking by excess thymidine. Percentages of BrdU-positive cells are indicated. (F) Distribution of colony-forming cells replated on days 2 and 8. One hundred randomly selected colonies were classified into 1 of 3 groups by the number of cells constituting the individual colonies. Percent of colonies composed of various cell numbers is shown on the y axis. The data represent mean ± SD of 3 separate experiments.

