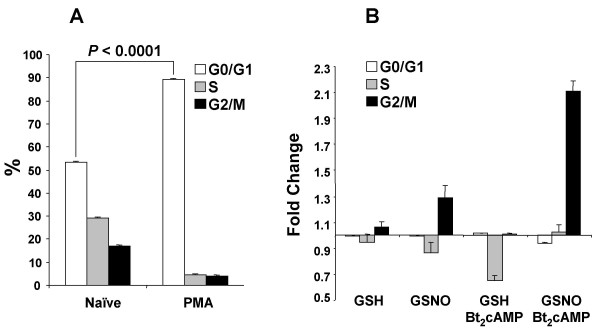
Figure 4.
Cell cycle analysis of U937 cells. (A) U937 cells (1 × 10⁶) were differentiated with PMA (100 nM) for 48 h and then compared with naïve cells for cell cycle distribution using propidium iodide staining. The cell cycle distribution of stained cells was examined by flow cytometry. The percentage of cells in G0/G1, S, and G2/M was determined using ModFit software. (B) U937 cells (1 × 10⁶) differentiated as in A were treated for 24 h with medium alone, medium with glutathione (GSH; 400 μM) or medium with S-nitrosoglutathione (GSNO; 400 μM) in the absence or presence of dibutyryl-cAMP (Bt2cAMP; 100 μM). Cell cycle distribution data, presented as fold change (percentage of cells in each phase of the cell cycle relative to medium alone), are means ± SE of four independent experiments.

