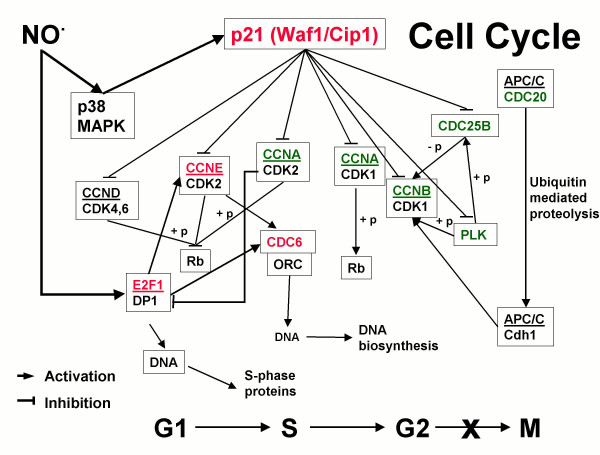
Figure 8.
Schematic representation of NO• regulation of the cell cycle. Genes differentially regulated in this investigation are shown in color; red signifies up- and green down-regulation. At the bottom, NO• is depicted as allowing progression to G2 where it induces cell cycle arrest. KEGG pathway [86] reproduced and Modified with permission.

