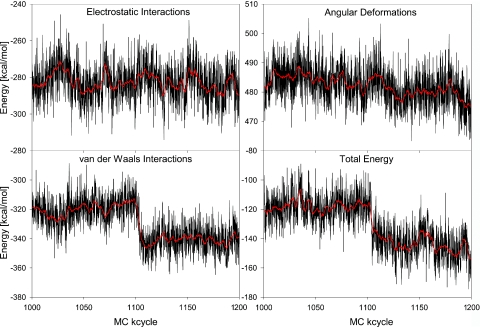
Figure 5.
Energy variation upon the MB–DNA-binding-mode transition. The energy components and total energy are shown as a function of MC cycles for the part of the trajectory between 1000 and 1200 MC kcycles that includes the transition from MB intercalation to minor-groove binding. The binding-mode transition occurs shortly after 1100 MC kcycles. MC snapshot values of every 100th MC cycle (in black) are complemented by their smoothed course over the MC trajectory (in red).

