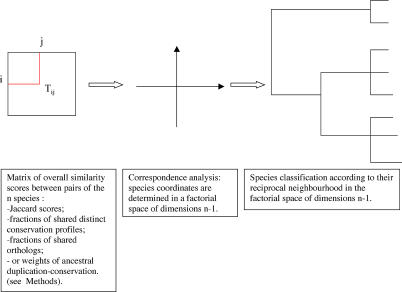
Figure 3. Genome Tree Construction.
The flow chart details the three steps in genome tree construction. In the first step a data matrix is constructed, based on overall similarity scores between pairs of species (i.e., the fraction of shared distinct conservation profiles, Jaccard scores, fraction of shared homologs, or ancestral duplication conservation weights). In the second step, correspondence analysis is performed on the data tables, for constructing the corresponding factorial spaces (orthogonal systems of dimensions n–1, with n the number of lines in the considered matrices). In the third step the genome trees are derived based on the reciprocal neighboring of the species from their Euclidean distances, as calculated in the factorial spaces.

