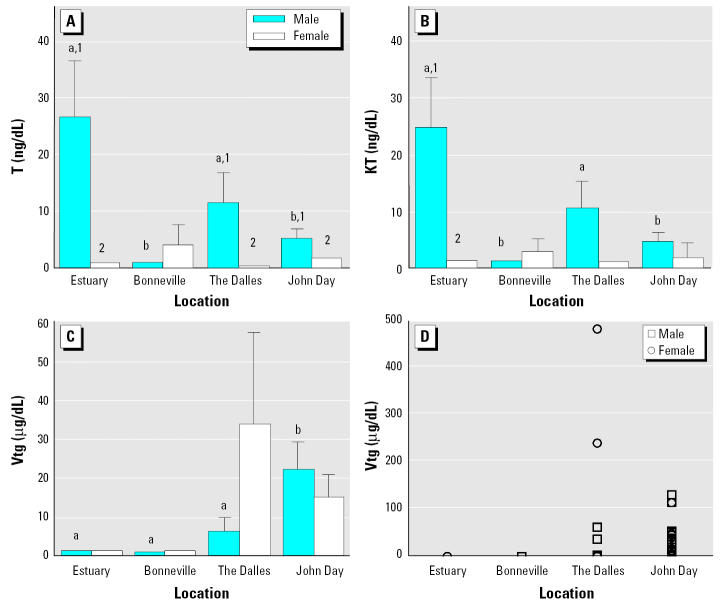
Figure 5.
Mean plasma concentrations (± SE) of T (A), KT (B), and Vtg (C) and individual Vtg concentrations (D) in male and immature female white sturgeon from four locations on the Columbia River. Each bar represents a sample size of 19–24 (A–C). Means with different letters or numbers indicate a significant difference between locations or between sexes within a location, respectively (ANOVA, p < 0.05).

