
Figure 4.
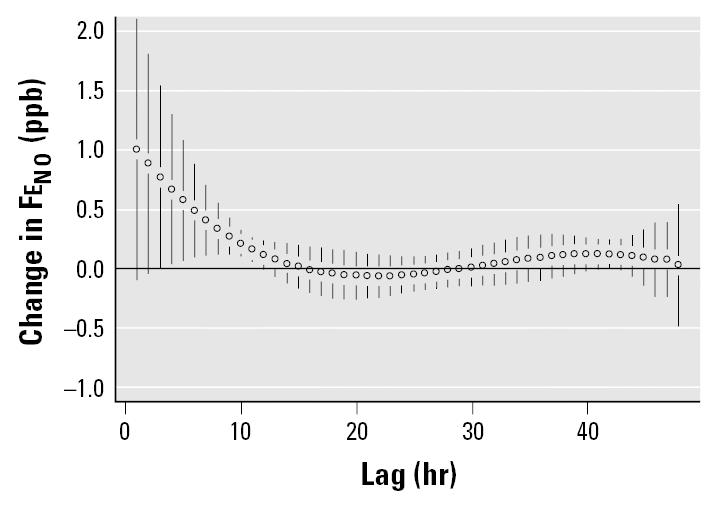
Change in FeNO per 10-μg/m3 increase in PM2.5 in subjects not prescribed ICS therapy. TEOM readings averaged from three sites using GEE model. Error bars indicate 95% confidence intervals.
Official websites use .gov
A
.gov website belongs to an official
government organization in the United States.
Secure .gov websites use HTTPS
A lock (
) or https:// means you've safely
connected to the .gov website. Share sensitive
information only on official, secure websites.
Change in FeNO per 10-μg/m3 increase in PM2.5 in subjects not prescribed ICS therapy. TEOM readings averaged from three sites using GEE model. Error bars indicate 95% confidence intervals.