
FIG. 1.
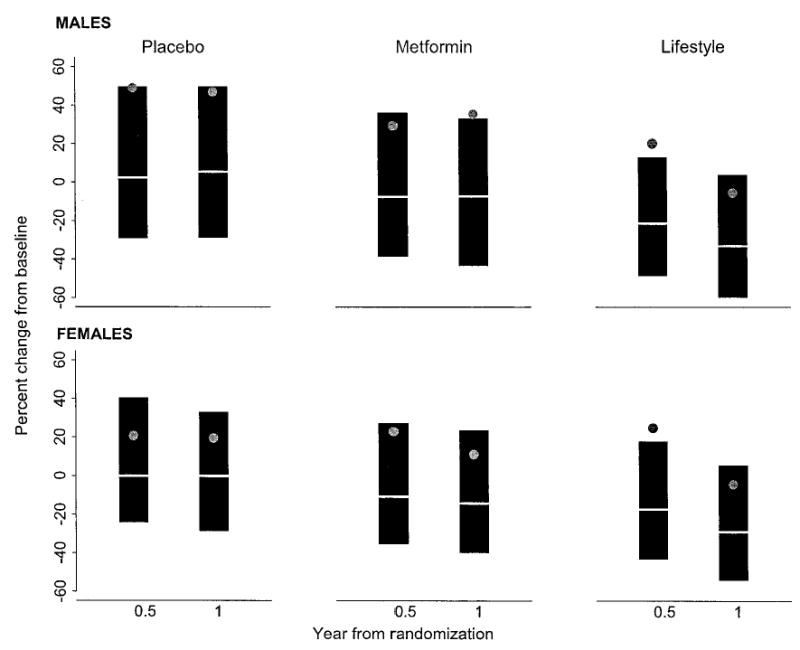
Median percentage of change in CRP from baseline at month 6 and year 1 by sex. The data are presented as mean (gray dot), median (white line), and 25th (top of the gray box) and 75th percentiles (bottom of the gray box). At 6 months and at year 1 after randomization, the Wilcoxon’s test yielded P < 0.001 for intensive lifestyle vs. metformin and intensive lifestyle vs. placebo in both men and women. After 6 months and 1 year of intervention, the P value from the Wilcoxon’s test between metformin vs. placebo was <0.001 for women. Among men, the Wilcoxon’s test for comparing metformin vs. placebo yielded P = 0.01 at 6 months and 0.006 at year 1.