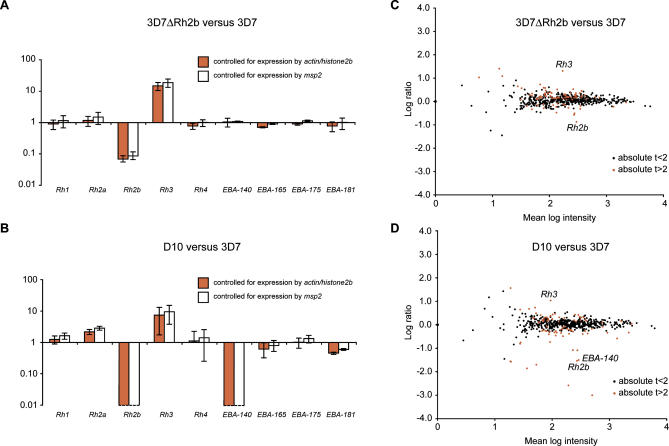
Figure 2. Comparison of Transcription of Key Invasion Genes in 3D7, 3D7ΔRh2b, and D10.
(A and B). Expression levels of EBA and PfRh genes controlled by the relative expression of either actin and histone 2b (two constitutively expressed genes) or msp2 (a gene expressed later on in the life cycle). Error bars represent the 95% confidence interval (CI) of values from two to three independent amplifications.
(C and D) Affymetrix microarray comparison of log gene expression intensity (as measured by MOID) between cRNA isolated from late-schizont 3D7 and (C) 3D7ΔRh2b or (D) D10 parasites. Data shown are restricted to 548 genes whose expression profile matches clusters 4, 13, 14, 15 [34], including genes that encode proteins known to be involved in invasion. Color represents significance of the change in the level of gene expression as measured by the t-statistic (<2 black, >2 red). The control genes PfRh2b (knocked out) and EBA-140 (deleted in D10) and upregulation of PfRh3 are shown.

