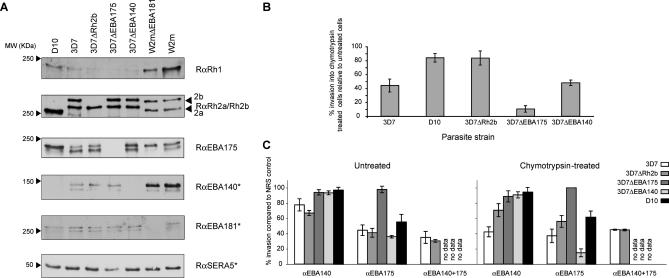
Figure 4. Changes in Protein Levels Do Not Underlie the 3D7ΔRh2b Chymotrypsin-Resistant Pathway.
(A) Western blot of parasite culture supernatant material probed with rabbit polyclonal antibodies against the functional EBA and PfRh proteins. SERA5 is used as a loading control. Antibodies marked with an asterisk (*) indicate the same gel stripped and reprobed with a different antibody.
(B) Invasion into chymotrypsin-treated erythrocytes for five parasite lines represented as the percentage of invasion to that into untreated erythrocytes.
(C) Invasion into either untreated or chymotrypsin-treated erythrocytes in the presence of protein-G purified polyclonal rabbit antiserum raised against recombinant EBA-140 and EBA-175 (or both together). Values are represented as the percentage of invasion in the presence of NRS. Error bars represent the 95% CI from three independent assays.

